Tag Archives: soccer

World Cup 2014 Data

It’s been a while since the last post I made on this blog, but it’s World Cup season so I had to contribute something.

I’ve collected some player/team data from the FIFA website which anyone can download and find interesting stuff. I’ve only put basic data in there, nothing too technical, but there is a collection of passing and tracking stats and a handful of other categories for every game so far: World_Cup_2014_group_stage < Click to download data in .xlsx format

If you use this data and see any problems with it let me know. For the USA-Ghana match, a handful of the stats didn’t seem to be published in the usual format so that one is incomplete. I also noticed that the high-intensity distance covered stats for the same game looked strange (probably incorrect) – use with caution.

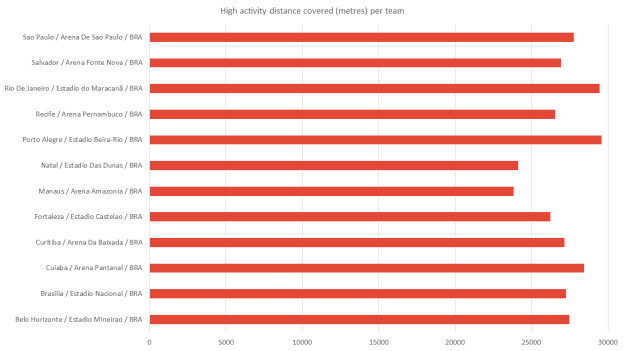
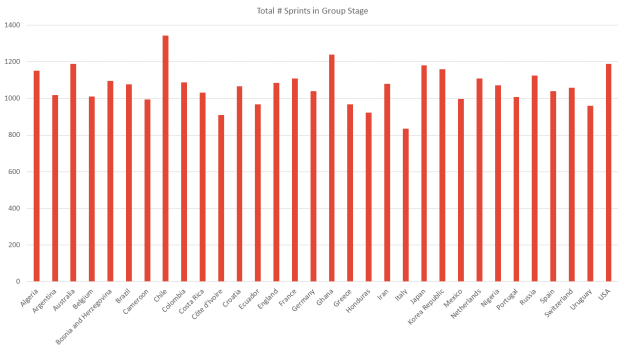
Here is a small selection of charts based on the published dataset…


high-activity-dist-covered


(*NB I removed values for USA-Ghana in the above chart)

total-sprints-groupstage

total-passes-groupstage

top-speeds-groupstage

Srna and Di Maria pop up a couple of times with top speeds clocked over 31km/h. Aurier was observed at the fastest speed of 33.52km/h in the Ivory Coast-Colombia game.

top-20-distcovered-groupstage

For total distance covered Bradley makes 3 appearances in the top 20 for his efforts in all 3 games.

Model pitfalls and further discussion of TPOEM

Since my previous post introducing a new model for football analysis, TPOEM, I have developed and integrated some significant improvements to it.

Firstly the speed in which I can give predictions based on team starting line-up (involving less manual input, more automation) is much better, so last Saturday I was able to tweet about the model’s predictions well before the 3pm kick-offs began.

Secondly I have added a manager/leadership factor into the analysis which is dynamic and unique to each team.  This adjustment is intended to ‘smooth’ the team level aggregate scores that TPOEM calculates, where the model would not otherwise capture a persistent difference between a team’s results and their underying scores. This offsets (albeit not completely) the difference between the model’s league table compared to the actual league table. Why does that happen? Well, the basic underlying reason is the same as why a shots on goal league table does not reflect the real league table. I attribute this to a kind of quality factor that I am not picking up in the statistics I use: quality in terms of shooting can relate to the position on the pitch of a shot, whether defenders pressured the attacker and how much of a contribution the assist added to a goal scored. This quality factor will also incorporate a team’s record at home or away. For reference, the model currently seems to think that Stoke and Norwich are outperforming particularly well whilst Wigan, Southampton and QPR are all doing worse in the league than TPOEM suggests they should be doing. That might be due to luck, team playing style, management, player leadership, quality or all of the above. The model should now be slightly better at accounting for that.

Predicting part 2

So the first week of predicting using TPOEM brought me a net proft, although my biggest win was West Ham away win vs Stoke – and I’ve already explained that the model was distinctly anti-Stoke before the most recent update!

Again, as ever, I am seeking value so even if TPOEM suggests a probability of an event win/draw/loss of about 40%, if the bookmakers quote odds of 35% then I consider it an attractive bet. As it stands I haven’t been that selective about what I bet on: in fact so far I’ve been betting on every match that I ran the model for even though in many cases the model didn’t really suggest any particular value vs bookies.

The result this week, from 5 games, was another net profit, this time +26% return (it was +56% last time). But that came from 2 wins, 1 void, 2 lost bets, so in a sense the net result was neutral.  I profited overall because I weighted my bets towards the most attractive in terms of value – the biggest win being a draw-no-bet backing Everton at home to Man City. The model really liked Everton’s chances mostly because Kompany, Aguero and Yaya Touré were all missing for Man City.

I also backed draw-no-bets for Liverpool, Villa and Stoke: lost, won, void respectively. And lastly I went with a draw for Swansea-Arsenal (lost) but in retrospect I shouldn’t have bothered with that bet because the model gave no conclusive direction for the game and the odds weren’t good either.

As I reformat the model’s data and find a better way of communicating its predictions/results I will publish more information on the blog as I recognise I have kept most of the details pretty close to home so far. When I’m at my desk for the 3pm kick-offs I will also tweet about the model’s predictions so if you’re interested look out for that but if you bet then you are doing so at your own risk!!!

Introducing TPOEM

I must say I sometimes get irritated by the overuse of acronyms in today’s world but this time I’ve created my own. TPOEM rather unimaginitively stands for The Power Of Eleven Model which I have been developing over the past few weeks.

TPOEM is the culmination of fairly light research into simple OPTA-derived football statistics that I have been analysing over the past 6 months or so. Having only really put the information together over the past week or so, it is a bit foolhardy to discuss TPOEM in any detail right now – but I have already begun using it to objectively rate player/team performance and even test its efficacy at predicting match results.

I will give some detail into how the model works. The first point of note is that it is a bottom-up system.  That means that it primarily analyses player data first and team data second. There are many reasons I wanted to approach the analysis in this way:

  • A focus on player statistics gives an objective view of a player’s importance to a team, and can help indicate which players contributed most/least to a team’s performance
  • Player statistics like goals scored and assists are readily available and easily compared between players at different clubs
  • TPOEM can potentially capture information that is useful to understanding team playing styles
  • TPOEM can potentially be used to give a prediction of a match result based on the team starting line-ups, which will give a clearer expectation of a result if key players from either team are missing

Although TPOEM is derived from fairly simple statistics, the most recent iteration incorporates 36 statistics including stats from goals scored and shots on target to tackles and ground duels. I have weighted the utility of each action and applied success rates where available to give a rating in simplified categories:

  • Defending/Ball winning
  • Passing/Ball retention
  • Attacking
  • Discipline
  • Involvement
  • Goalkeeping

Of course the overall scores are adjusted so that the most frequent actions (passing, touches, etc) do not grossly outweigh the less frequent, but arguably more important, actions such as shots on target and goals scored. At the same time, I tried to maintain some care over the relevance of goals as a statistic – of course goals win games, but why should TPOEM rate attackers more highly than defenders because they score more often? Strikers often take all the plaudits for scoring goals but since most goals are scored inside the box I have tried not to unduly credit a goal scored – in many instances it is easier to score a goal than miss. I took a similar view of assists, seeking not to overly ramp-up a player’s score simply because he completed a pass (however important it was). I have to stress that it still wasn’t quite a finger in the air approach to rating – I have reviewed correlations to team performance at various layers with the aim of giving my weightings a scientific basis.

I have now tinkered with the algorithms enough times to realise that although TPOEM in one sense gives an objective rating of player performance, but in another sense remains a reflection of its creator’s biases and research. This is limitation of any model, which can only be improved by testing and further research.

What about results? Well I will keep publishing information over the coming weeks as I look to find suitable ways of presenting TPOEM’s output.

For now, I have run the model on the first 271 games of the premier league season (i.e. before the kick-offs on the 2 March), and I can announce its candidates for the most man of the match performances so far this season:

Player MoM awards
Santiago Cazorla 13
Gareth Bale 10
Adel Taarabt 8
Eden Hazard 8
Leighton Baines 7
Luis Suárez 7
David Silva 6
Dimitar Berbatov 6
Juan Mata 6
Marouane Fellaini 6

This highlights the importance, according to TPOEM, of Santiago Cazorla to Arsenal’s season in terms of match-winning performances. Both Manchester sides and Arsenal lead the team man of the match awards with 22 apiece, the difference being that there is a much larger spread of players who have put in top performances for United and City in the league.

Predicting

Those readers who follow me on twitter will have noticed that TPOEM liked the value of the chances of a home win for Everton and draws for Swansea vs Newcastle and Manchester United vs Norwich. Please note that this isn’t a direct match result prediction for the above – TPOEM actually had all 3 as odds-on for home wins, but the probability of a draw when compared to quoted bookmakers odds before 3pm seemed attractive at the time.

The main problem I had was in finding an efficient way to input all the line-ups in time for kick-off!

As it was, I completed my efforts and placed bets on all the 3pm kick-offs by 3.25pm – something I will have to work on going forward.

In addition to the above bets, of which only Everton’s home win against Reading paid off, I bet on a draw for Sunderland-Fulham (profit) an away win for West Ham (profit) and a win for QPR. 2 of these bets were actually placed live, with the scores at 0-0, whilst QPR were already 1-0 up at Southampton when I took the gamble of backing them to win. According to TPOEM, Chelsea were massive favourites at home to West Brom so I decided not to bother with a gamble on that game.

Most pleasing was the away win of West Ham at Stoke – a game which I am sure could just as easily have gone either way. When I ran the line-ups through TPOEM West Ham had actually already made 2 early substutions so I incorporated those new players into the line-up. The model indicated about a 30% chance of West Ham winning which was attractive enough when compared to quoted odds of about 9/4. Fortunately for the early prospects of TPOEM they duly achieved an unlikely result at the Brittania.

I will continue to test TPOEM’s predictive efficacy vs bookmaker odds but for any followers of the blog, please note that I am seeking value not outright wins. Even if Manchester United are heavy favourites to win at home, as they were at the weekend, I may suggest another outcome if the odds are attractive enough depending on what my early-stage model tells me!

Feeding off scraps in the Premier League?

Having looked at the top scoring strikers in the league in a previous post on the race for the golden boot, I now turn my attention to shooting statistics for the leading target men at teams in the bottom half of the table. Players for these teams often ply their trade as a lone striker, with less than average support from midfield. As a result the pressure on them to score every gilt-edged chance is high since every goal is precious for their club to ensure survival.

After only 16 games of the season played these players all have 6 goals or less, so each goal or missed opportunity has a strong bearing on their stats (disclaimer!).

The strikers considered this time round are Djibril Cissé (QPR), Christian Benteke (Aston Villa), Adam Le Fondre (Reading), Arouna Koné (Wigan) and Rickie Lambert (Southampton). Cissé, who has played the least in terms of outfield minutes, has also scored the least with only 2 goals for winless QPR. Rickie Lambert is the most prolific goalscorer so far with 6 goals for Southampton. At the time of writing QPR sit 20th in the league with 7pts and Reading just ahead of them on 9pts, whilst Wigan, Aston Villa and Southampton are all level on 15pts. All stats correct as at 12 December, using EPL Index / Opta data.

Efficiency 11 Dec Goals & Shots per 90 11 Dec

Goals & Shots per 90 Data 11 Dec 2Of the 5 strikers, Arouna Koné takes the fewest shots with only 2.49 per 90mins, on average this is far less than Cissé, Benteke and Le Fondre, who each manage to shoot over 3.5 times per 90mins. But shots alone do not necessarily indicate the quality of opportunities on hand – indeed the current league top scorer Michu currently has a shots per 90mins rate of 3.13. Cissé’s low shots on target rate at under 30%, of which only a paltry 20% have been goals, has not done much to help QPR’s cause.

Le Fondre and Lambert are easily outperforming the others from this perspective because the quality of their shots is shown to be generally much higher – and so although they take fewer shots per game their goalscoring rates are significantly better off (c0.45 goals per 90mins). Lambert has a particularly good record of making the opposition keeper work when he has a shot: he has hit the target 47.4% of the time.

Big Chance Data 11 Dec

Big Chance Economy 11 Dec Big Chances 11 Dec

When it comes to big chances, Koné in particular fares poorly.  Although both he and Cissé have a conversion rate of 25%, Koné has had several more gilt-edged chances than Cissé (12 vs 4 respectively). Roberto Martinez will no doubt be disappointed by the return from Koné, however on the plus side the sheer frequency of big chances he is involved in may be a positive sign for the team’s prospects. The small sample size for Cissé means that his conversion rate of 25% perhaps does him a disservice at this point in time – if he scores his next one it’ll jump up to 40%.

Benteke, who in recent weeks has kept Darren Bent out of the Aston Villa team, does not perform particularly well in this analysis. Judged purely by the stats in this post he resembles Cissé much more than Lambert, with below average shooting accuracy and below par big chance conversion.

Of the group, unsurprisingly it is Lambert again who does best with big chances with an excellent conversion rate of 75% (3 from 4). When Southampton have needed him most so far he has come up with the goods, but whether that form continues for the rest of the season is another matter.

Premier League 2011-12: Player Impacts – discussion

In previous posts I have tested different ways of rating players using Opta data to mark out key fields for each major position which correlate positively to points.  The summary of these reviews can be read here.

What troubled me about some of the findings in this process was the underperformance of some high-profile players whose strengths were clearly not rewarded by the analysis. For example, Ashley Cole, Theo Walcott, and even Fabricio Coloccini – who actually made the PFA Team of the Year last season. Although I’m pretty keen to separate subjective opinion from raw data analysis, in particular the presence of Coloccini in the PFA Team of the Year – voted for by fellow professionals – cannot be disregarded lightly. Not to mention his superb performance at the weekend!

So in this series of posts I have published another ‘view’ of footballers – this time looking at team performance in the league with and without a particular player in the starting line-up. This can be used as a simple indicator regarding which players’ presence helps/detracts from their team. I used Tableau Public for the first time for this, and had some teething issues attaching my graphs/tables, so they are shown in separate posts below.

Method

I calculated the average points gained, team goals scored and team goals conceded for every team and player and compared this to the team averages without that player in the starting line-up. Of course, those who started every game don’t have a ‘without’ average so I removed players who started every game. In addition, I took out players who started fewer than 4 games, and players who started more than 34 games. I did this on a whim after I saw that Robin van Persie had a negative impact to Arsenal’s points average – this happened because he started 37 games for Arsenal last season, and in the 1 game he didn’t start Arsenal won against Stoke. This annoyingly made Arsenal’s points average without RVP as 3pts per game, which is a bit ridiculous when he came off the bench and scored 2 in that game anyway! Players with 1 start had a similar problem, as the result of that game determined their impact. That example serves a purpose in explaining the limitations of a data table like the one below, even though the bias is reduced by increasing the min/max number of starts to 4 and 34. Of course if a player started in 34 games but the 4 he missed were away visits to Man City, Man Utd, Arsenal and Spurs then again his points average is more likely than not to be a little too high.

All the impacts below need to be taken with a pinch of salt but information is power, and I think this review is complementary to my previous player analyses and will help to give a better profile of players and their contribution to team performance. Incidentally, in this review Coloccini didn’t qualify because he started 35 games last season.

Hopefully, the tables/graphs are self-explanatory, but here are some highlights:

  • Adebayor for Spurs had the biggest positive effect on points for any team, followed by Arteta for Arsenal
  • Theo Walcott and Ashley Cole both had a strong positive effect for Arsenal and Chelsea respectively despite the poor stats analysis rating in previous posts
  • Notable ‘unlucky mascots’ for their teams were Berbatov for Man U and Ramsey and Arshavin for Arsenal
  • Swansea had a comparatively short range of differences between their players, which shows not only that they were able to field a remarkably consistent team for much of the season, but also perhaps indicates that no matter who was in the starting line-up, the player positions and tactics were relatively easy to substitute

Premier League 2011-12: Player Impacts – average points

The below graph, created using Tableau, shows the difference between points earned last season with that player in the starting line-up, vs points earned without (positive is good!) sorted by team.

Qualifying players were in a team’s starting line-up between 4 and 34 times to create a ‘sensible’ average points difference. For more information on the methodology click here.

An interactive version of the graph is available at the following link:

http://public.tableausoftware.com/views/EPL2011-12GlobalPlayerImpact/AvgPointsdifference?:embed=y

Premier League 2011-12: Player Impacts – goals for & conceded

I used Tableau to create the following graph of the positive/negative difference relating to goals for/against based on team averages with/without that player in the starting line-up that season.

Qualifying players were in a team’s starting line-up between 4 and 34 times to create a ‘sensible’ average difference. For more information on the methodology click here.

Use the version linked to below and hover over data points to see which player each star represents. NB. positive numbers are good for both goals for and goals conceded.

http://public.tableausoftware.com/views/EPL2011-12GlobalPlayerImpact/GoalsForvsCon?:embed=y

Premier League 2011-12: Player Impacts – data

Below is the full table of data, also viewable in Tableau Public at the following link:

http://public.tableausoftware.com/views/EPL2011-12GlobalPlayerImpact/Data?:embed=y

It’s not that easy to read the column headings but it’s basically team points with, team points without, difference – then the same order for goals for followed by goals against then a final goal difference average.

For the goals conceded difference I deducted team goals conceded without from team goals conceded with so that positive numbers are desirable – hence goal difference became goals for diff + goals conceded diff.

Qualifying players were in a team’s starting line-up between 4 and 34 times to create a ‘sensible’ average points difference. For more information on the methodology click here.

Premier League 2011-12: Stat attack

In this post I will publish some notable statistics and some charts from last season’s premier league. For example, did you know that there were 1066 goals scored last season, an average of 2.81 goals per game? And yet the number of big chances, as defined by Opta, averaged 3.58 per game.

Below is a chart illustrating some of the most signifcant ‘types’ of goals scored last season in proportion to their average frequency (there is some overlap):

Most of the other charts should be pretty self-explanatory:

Frequency per game:

Successful Unsuccessful Total
Dribbles 12.99 16.48 29.47
Short passes 619.89 124.59 744.48
Long passes 60.56 49.24 109.80
Corners 3.07 6.15 9.22

The next chart identifies how teams fared from direct free kicks throughout the season. 5 teams didn’t manage a single direct free-kick goal last season, but it was not for the want of trying, as Chelsea had 38 attempts with no success! Compare this to Sunderland, the most prolific scorers from direct free-kicks, who converted 5 of their 19 (success rate of 26.7%) with contributions from McClean, Gardner and Larsson (3).

Stacked points chart, home and away.  Only 3 teams: Bolton, WBA and Wolves won more points away from home than at home.

The next chart breaks down the number of shots per team, in order of the final league table positions. Just looking at the table by eye, you can see a trend between league position and number of shots. But there are some exceptions, such as Newcastle and Stoke, whose league position belies the trend in number of shots taken.

The last chart I will publish in this post shows the frequency and success rate of headed shots per team.  We can use this to establish which teams tended to use the aerial threat of their attackers more/less than average. Here it is clear that Stoke, Wolves and Liverpool created the most headed shots, perhaps due to an emphasis on crossing the ball from wide positions.

Premier League 2011-12: ‘Dream Team’

So with my position reviews now complete, I have a few points to make about the processes I have tested and what can be learnt. What will be more interesting to some readers is the fact that I can now also publish an alternative ‘Dream Team’ for last season based on my bespoke analysis.

All of the data analysed in these position reviews considered players who had played a total of more than 1000mins from a place in the starting line-up – with the one exception made for central attacking midfielders (for whom the limit was 500mins). As a result, players who made a habit of substitute appearances or a positive (or negative) impact from the bench – Theo Walcott springs to mind here – may not be considered fairly. In addition, players who were injured or out of favour for a significant proportion of the season may have shown themselves to be truly important when they did play but again didn’t qualify for my lists – perhaps for example Carlos Tevez, Hatem Ben Arfa and Nemanja Vidic.

In addition, I tested different weighting methodologies for each position review. The weightings used are obviously essential to the the final tables by which players are ranked and it should be noted that very different lists can be easily calculated with a few tweaks to the model. This is not intended to be a definitive ‘who is best’ rating but rather a simple test of how players can be compared to one another with an eye on correlations to wins, draws and losses.

Lastly, one season does not make a great player and the game evolves from year to year. As a result, we can’t make any concrete conclusions from 1 season’s worth of data. The availability of this data has certainly encouraged me to seek out more where possible – of course, the bigger the sample size, the better the chances of making a definitive conclusion.

The key general qualities I found for each position are noted below:

Goalkeepers with a high proportion of saves to shots, good passing accuracy and low error frequency are the qualities that seemed most important for this position last season. No surprises there. Looking back at my review, and influenced by recent discussions by other bloggers regarding keeper behaviour, we can imagine that all of these ratios are quite dependent on the team in which the keeper plays. It can be argued that the best defences limit good shooting opportunities, so perhaps it is inevitable that Joe Hart and de Gea would perform strongly here. In addition, a keeper will surely have a low error frequency if he is put under pressure less often by opposing attackers. As for passing accuracy, it is up to the defenders/midfielders to make a reasonable attempt to find a position to receive the ball. At the weekend, Newcastle’s goalkeeper Steve Harper made an unwise attempt to dribble past Danny Welbeck (did he not see my striker analysis which showed Welbeck to have the highest recovery rate last season?!) – as a Newcastle fan, I could not believe that the ball was passed back to Harper and neither full back: Ferguson nor Santon, dropped back to offer a wide short pass opportunity. A revisit to this analysis would require some thought to how to reduce the bias to the team in which the keeper plays.

This type of argument also applies to other positions where my analyses could be scrutinised and improved by further research on the key areas which contribute to the fields I used.

Fullbacks seem to need to have a combination of strong ground duel ability and an aptitude to join the attack as much as possible. Going forward they are heavily involved in linking play in wide positions but also must have excellent reactions and positioning to defend one-on-ones against attacking wingers without picking up yellow cards too frequently. Strong aerial duel prowess is not necessary but would obviously be a bonus, as would goals and assists.

Centrebacks need to be strong in both ground and aerial duels, and the more assured they are on the ball the better as ‘unsuccessful ball touch’ is introduced to the analysis. Central defenders with a high clearance rate are useful for teams expected to be in the lower reaches of the league, whilst high passing accuracy is more important for the top teams. A decent goal scoring record (from corners/set pieces) is again a bonus.

Defensive midfielders are regularly under pressure from opposing attackers and midfielders. Good tackle success, interception rates and recovery rates are important. Being able to retain the ball is also important so one touch lay-offs and passing accuracy are useful in this position whilst heading ability or a propensity to find a teammate in an advanced position can be considered a bonus.

Central midfielders are most important going forward than in defence. As a result goals and chance creation were biased by my review, alongside good passing success in the middle third and ground duel success. Low dispossession rates are also important.

Wingers/wide attackers need to have some ability in retaining the ball in the opposition’s half. The more often the player in this position finds space to receive the ball the better the chance of creativity so a good touch per min rate is also useful. Dribbling is a bonus skill – whilst of greater importance is chance creation / goals. Defensive attributes such as ground duels and recoveries are notable but in general secondary to attacking qualities.

Central attacking midfielders are all about chance creation, ball retention and goalscoring with no serious defensive qualities neccessary in open play (positioning may be another matter). The central attacking midfielder is likely to see more opportunities to play through balls or shoot than other midfielders, hence a good shooting ratio and opposition half pass success are most important.

Like central attacking midfielders, strikers who have high shooting accuracy and goal conversion rates along with chance creation are most valuable. Heading, dribbling and recovery rates are next important to players in this position.

My dream team (and squad) for last season based on the position review series is below. The players included obviously performed best overall in the areas discussed above. I have modelled the team for 3 of the more popular starting formations to ensure coverage for every position I reviewed in my series:

This compares to the PFA team of the season listed below:

Pos. Player Club
GK Joe Hart Manchester City
DF Kyle Walker Tottenham Hotspur
DF Vincent Kompany Manchester City
DF Fabricio Coloccini Newcastle United
DF Leighton Baines Everton
MF David Silva Manchester City
MF Yaya Touré Manchester City
MF Scott Parker Tottenham Hotspur
MF Gareth Bale Tottenham Hotspur
FW Robin van Persie Arsenal
FW Wayne Rooney Manchester United

Compared to the PFA team Coloccini, Baines and Bale are not in my form team of the year although the rest are at least in my ‘squad’, if not in the starting line-up.

I can also show an alternate England team based on English players’ rating in these positions. Of course some of the players were either not included, injured or retired from international duty over the summer but it provides a different perspective on the England team that could have gone to Euro 2012.

The last comment I will make is the incredible performance of Manchester City players in all reviews because in every position City were represented by a player in the top 2 except central attacking midfield – in which Agüero (who came 2nd in the striker review in any case) still finished in the top 5.

Comments welcome.